Reporting WebLogic Server JMX MBean Values Tutorial
WLSDM: Reporting WebLogic Server JMX MBean Values
2024/04/15

Reports / Metric Reports:
Easy, fast and responsive Oracle WebLogic monitoring & diagnostics.
WLSDM uses the metric harvester engine to collect report data and dashboard data.
Dashboards store only last 24 hours JMX MBean values.
For enabling unlimited data storing go to:
Configuration / Metric Browser
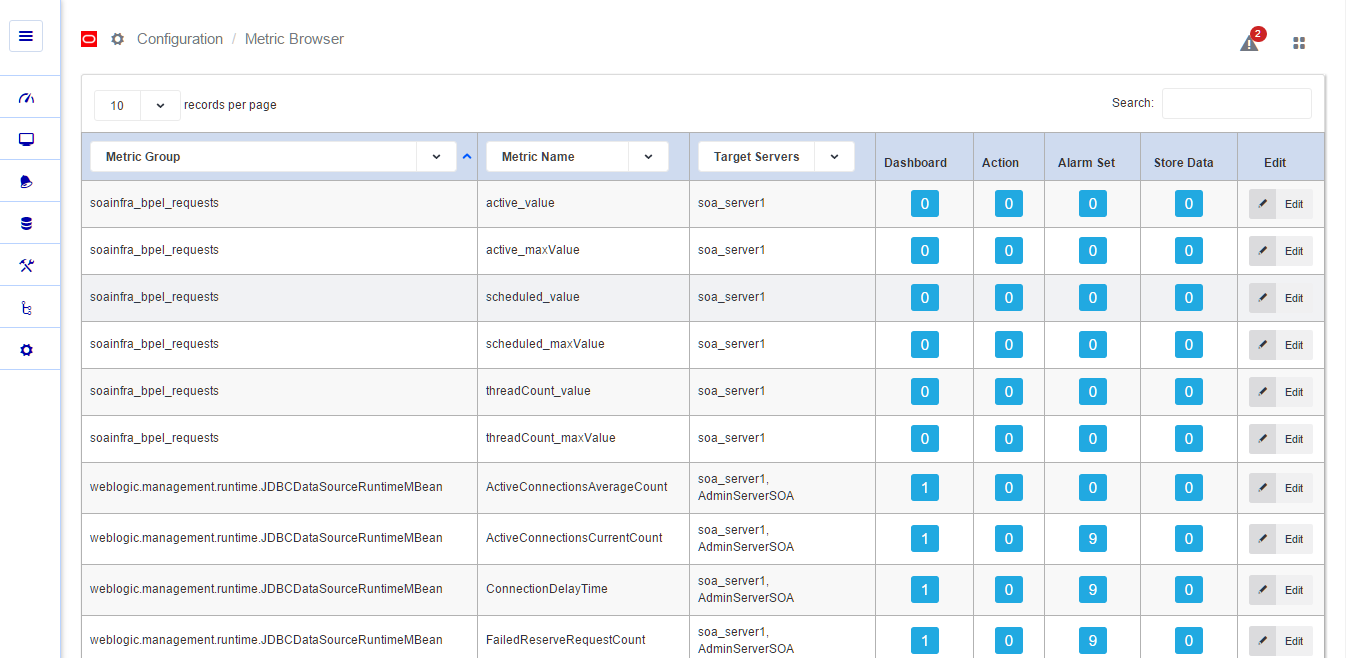
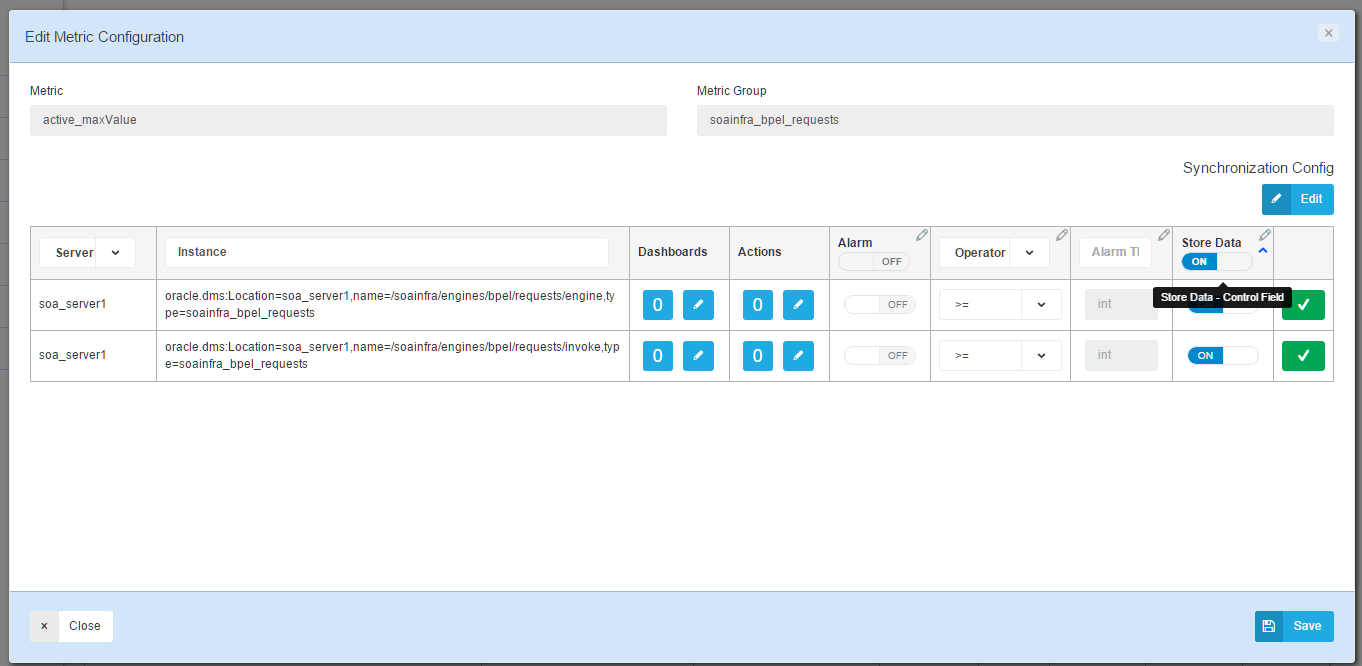
Click 'Edit' button and switch store data to ON / OFF:
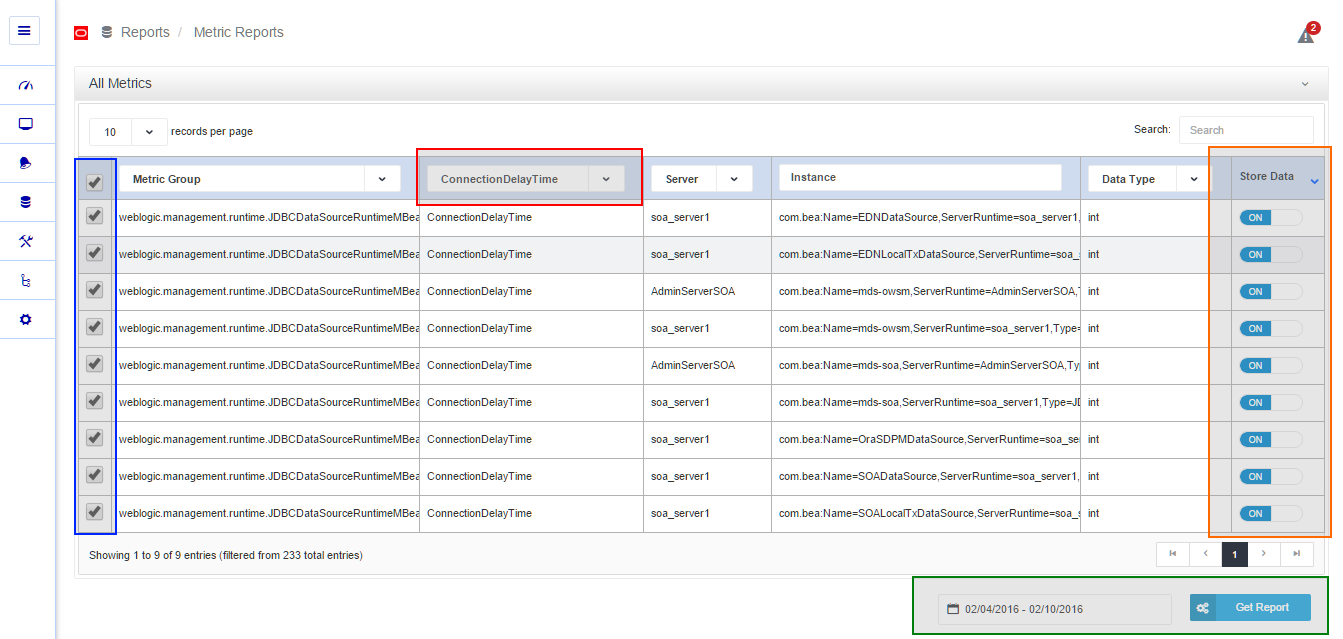
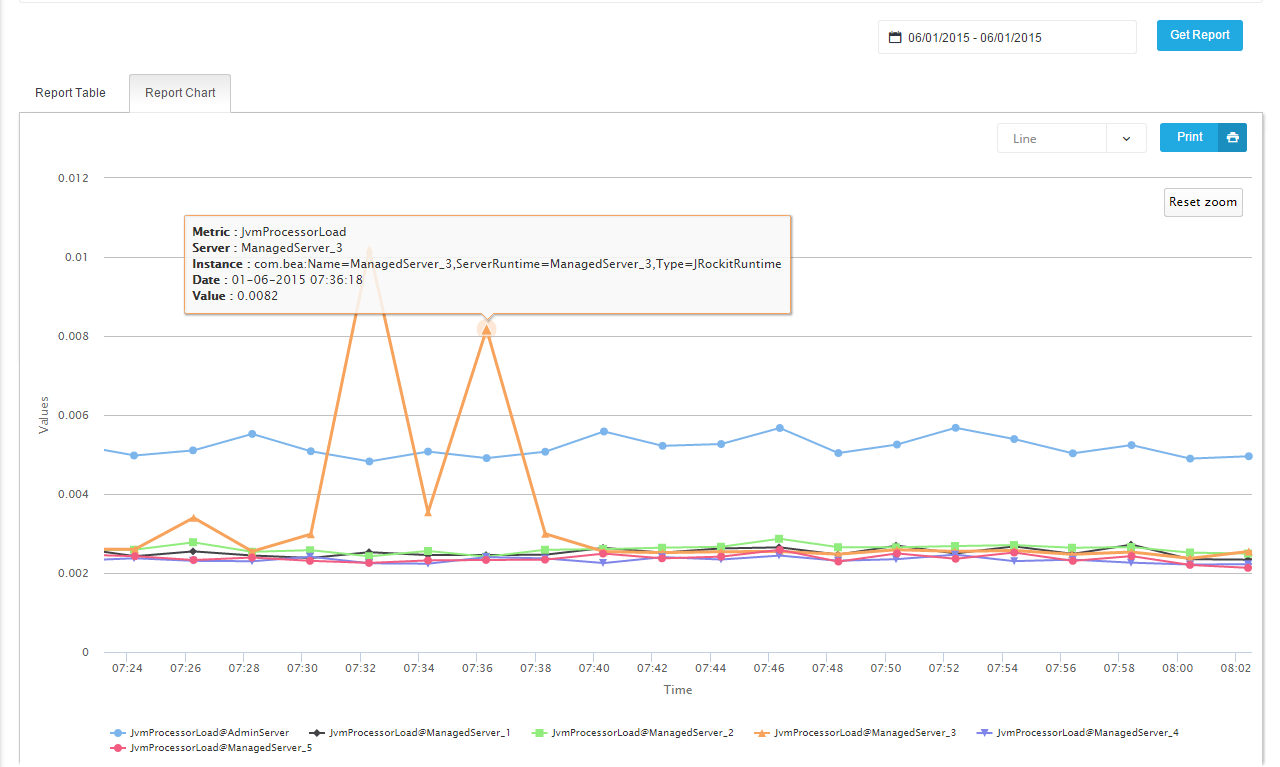
WLSDM - WebLogic Server Metric Reports: Query WebLogic JMX MBean Values
- Select metrics
- Select metric instances
- Choose date range
- Click on 'Get Report'
It's possible to export data as following formats:
- Copy (Clipboard)
- CSV
- Excel
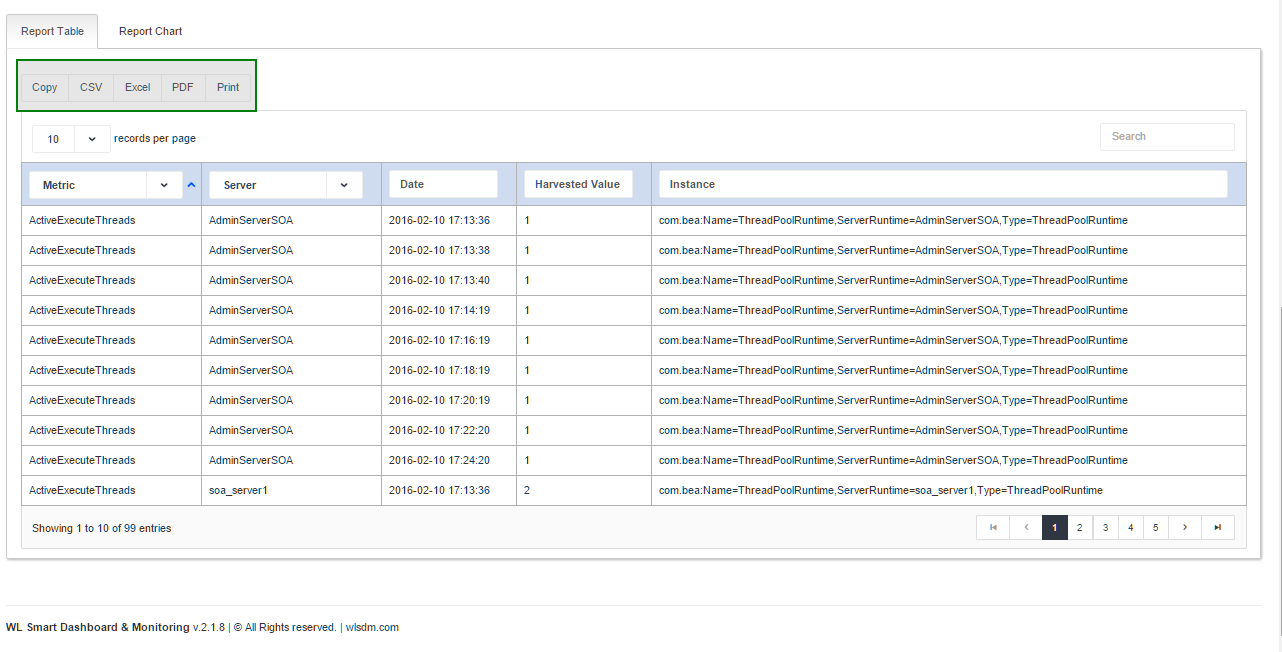
On 'Report Chart' tab, you can display charts in different chart types and also it's possible to print the chart.
WLSDM: WebLogic Server Metric Reports. Easy, fast and responsive monitoring & diagnostic. To check out other features: wlsdm.com/download/ WLSDM is a WebLogic Server conslole extension. So we call it native monitoring.
WLSDM installation takes just minutes and completely free in WebLogic development mode! Try it now.
Get immediate FMW Oracle WebLogic support and WLSDM monitoring support. Register Now! community.wlsdm.com
Additional WLSDM WebLogic Monitoring Tutorials
- How to install and use WLSDM?
YouTube Tutorial - Advanced WebLogic Monitoring and Automation:
Develop JMX MBeans (YouTube Tutorial, Sample JAVA Code, Documentation) - How to get WebLogic thread dump continuously?
Community Blog Post - Dashboard Usage
YouTube Tutorial - Actions (Thread Dump, Heap Dump, Java Flight Recorder (JFR), WLDF Image)
YouTube Tutorial - JMX MBean Metric Browser & Email Notifications
YouTube Tutorial - Application Response Times & Log Inspector
YouTube Tutorial
Download Latest WLSDM for WebLogic 11g, 12c and 14c
- Latest Version: v3.9.2 Watch WLSDM Trailer
- Quick Installation Guide: Available in ZIP package as README.html
- Online Documentation: Available in ZIP package as WLSDM-HELP.html